
An interactive Tableau dashboard exploring HR Analytics data trends involving hiring, gender, and education.
Tools & Skills Used: Data Analysis, SQL, Excel, Power Query, Tableau, Dashboard Design, HR Metrics
📊 Heads up, mobile explorers! While these dashboards technically work on your phone, they really prefer the spacious, luxurious real estate of a full browser. Think of it like trying to watch "Lord of the Rings" on a smartwatch — possible, but... why? 😅 For the full interactive magic, hop onto a desktop or laptop!
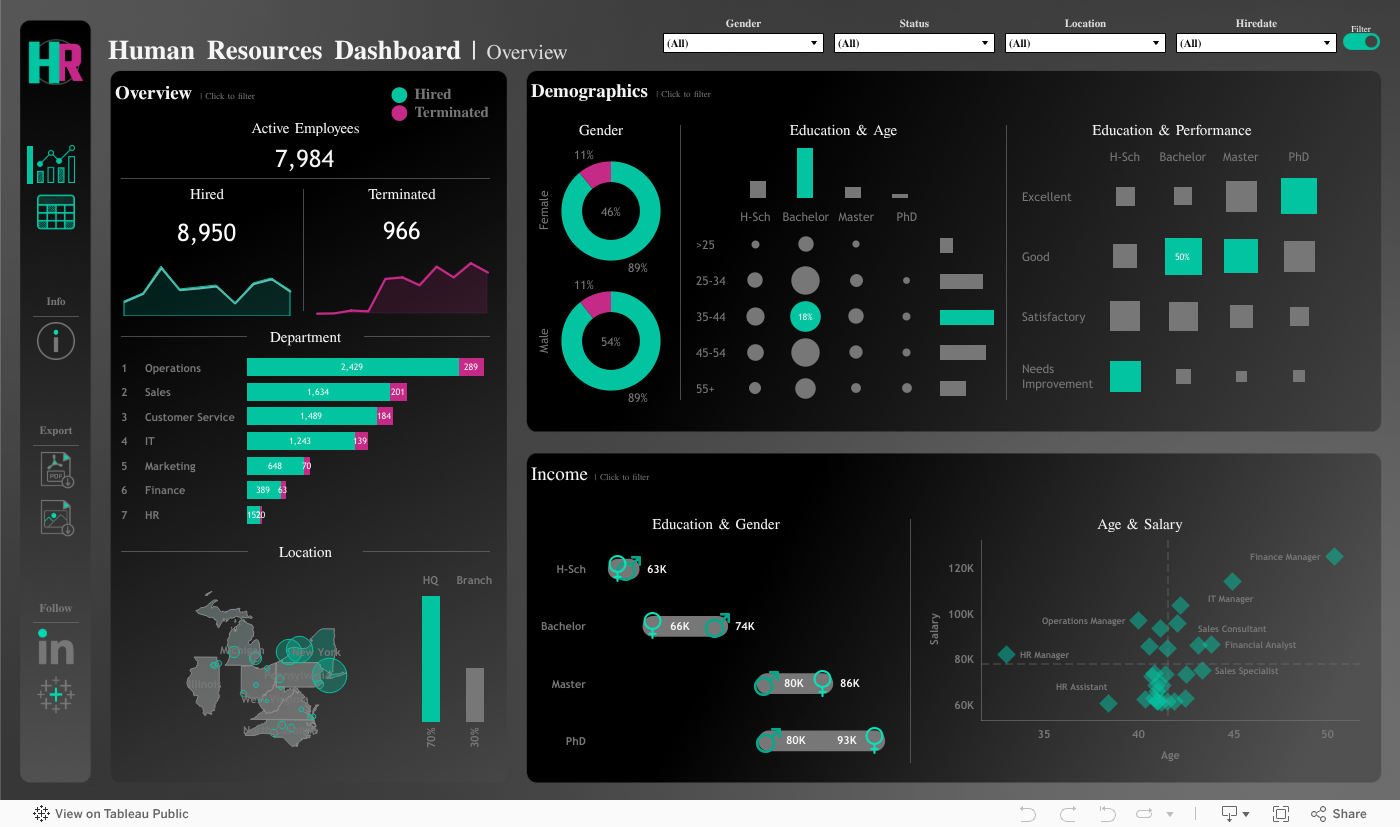
In many organizations, HR teams struggle to visualize workforce trends across departments and demographics. This project simulates a realistic scenario where leadership needs clear insights into headcount distribution, turnover patterns, and compensation equity to support strategic planning.
To address this, I developed a mock HR dashboard that mirrors challenges I’ve encountered in real-world roles—such as reconciling employee data across systems, segmenting workforce trends, and identifying areas for improvement. The project walks through my analytical process, from data prep in Excel to building insights in Tableau.